Search K
Appearance
We offer venue maps which can be downloaded from our CDN.
These maps are all made as SVGs so you can edit them yourself.
To download a specific SVG you need a venue_id and append the ‘.svg’ extension to it.
Add that to the url below to download the SVG.
https://cdn.xs2event.com/venues/{venue_id}.svghttps://cdn.xs2event.com/venues/1be866486fe54266a3b0015f5f0ce051_vnx.svgBecause venues often add, remove or change categories/stands, we can not guarantee that the venue SVGs are always up to date, but we do our very best to update them as fast as possible. If you think the SVG needs an update, please contact our support team.
Next to our SVG, we now also make two static version (PNG) available;
The first is very similar to what you see on our portal with only very basic information.
The latter includes a legend and coloring, highlighting all the categories we have available.
https://cdn.xs2event.com/venues/static/{venue_id}.pnghttps://cdn.xs2event.com/venues/static/{venue_id}-legend.pngExamples:
| Plain | Legend |
|---|---|
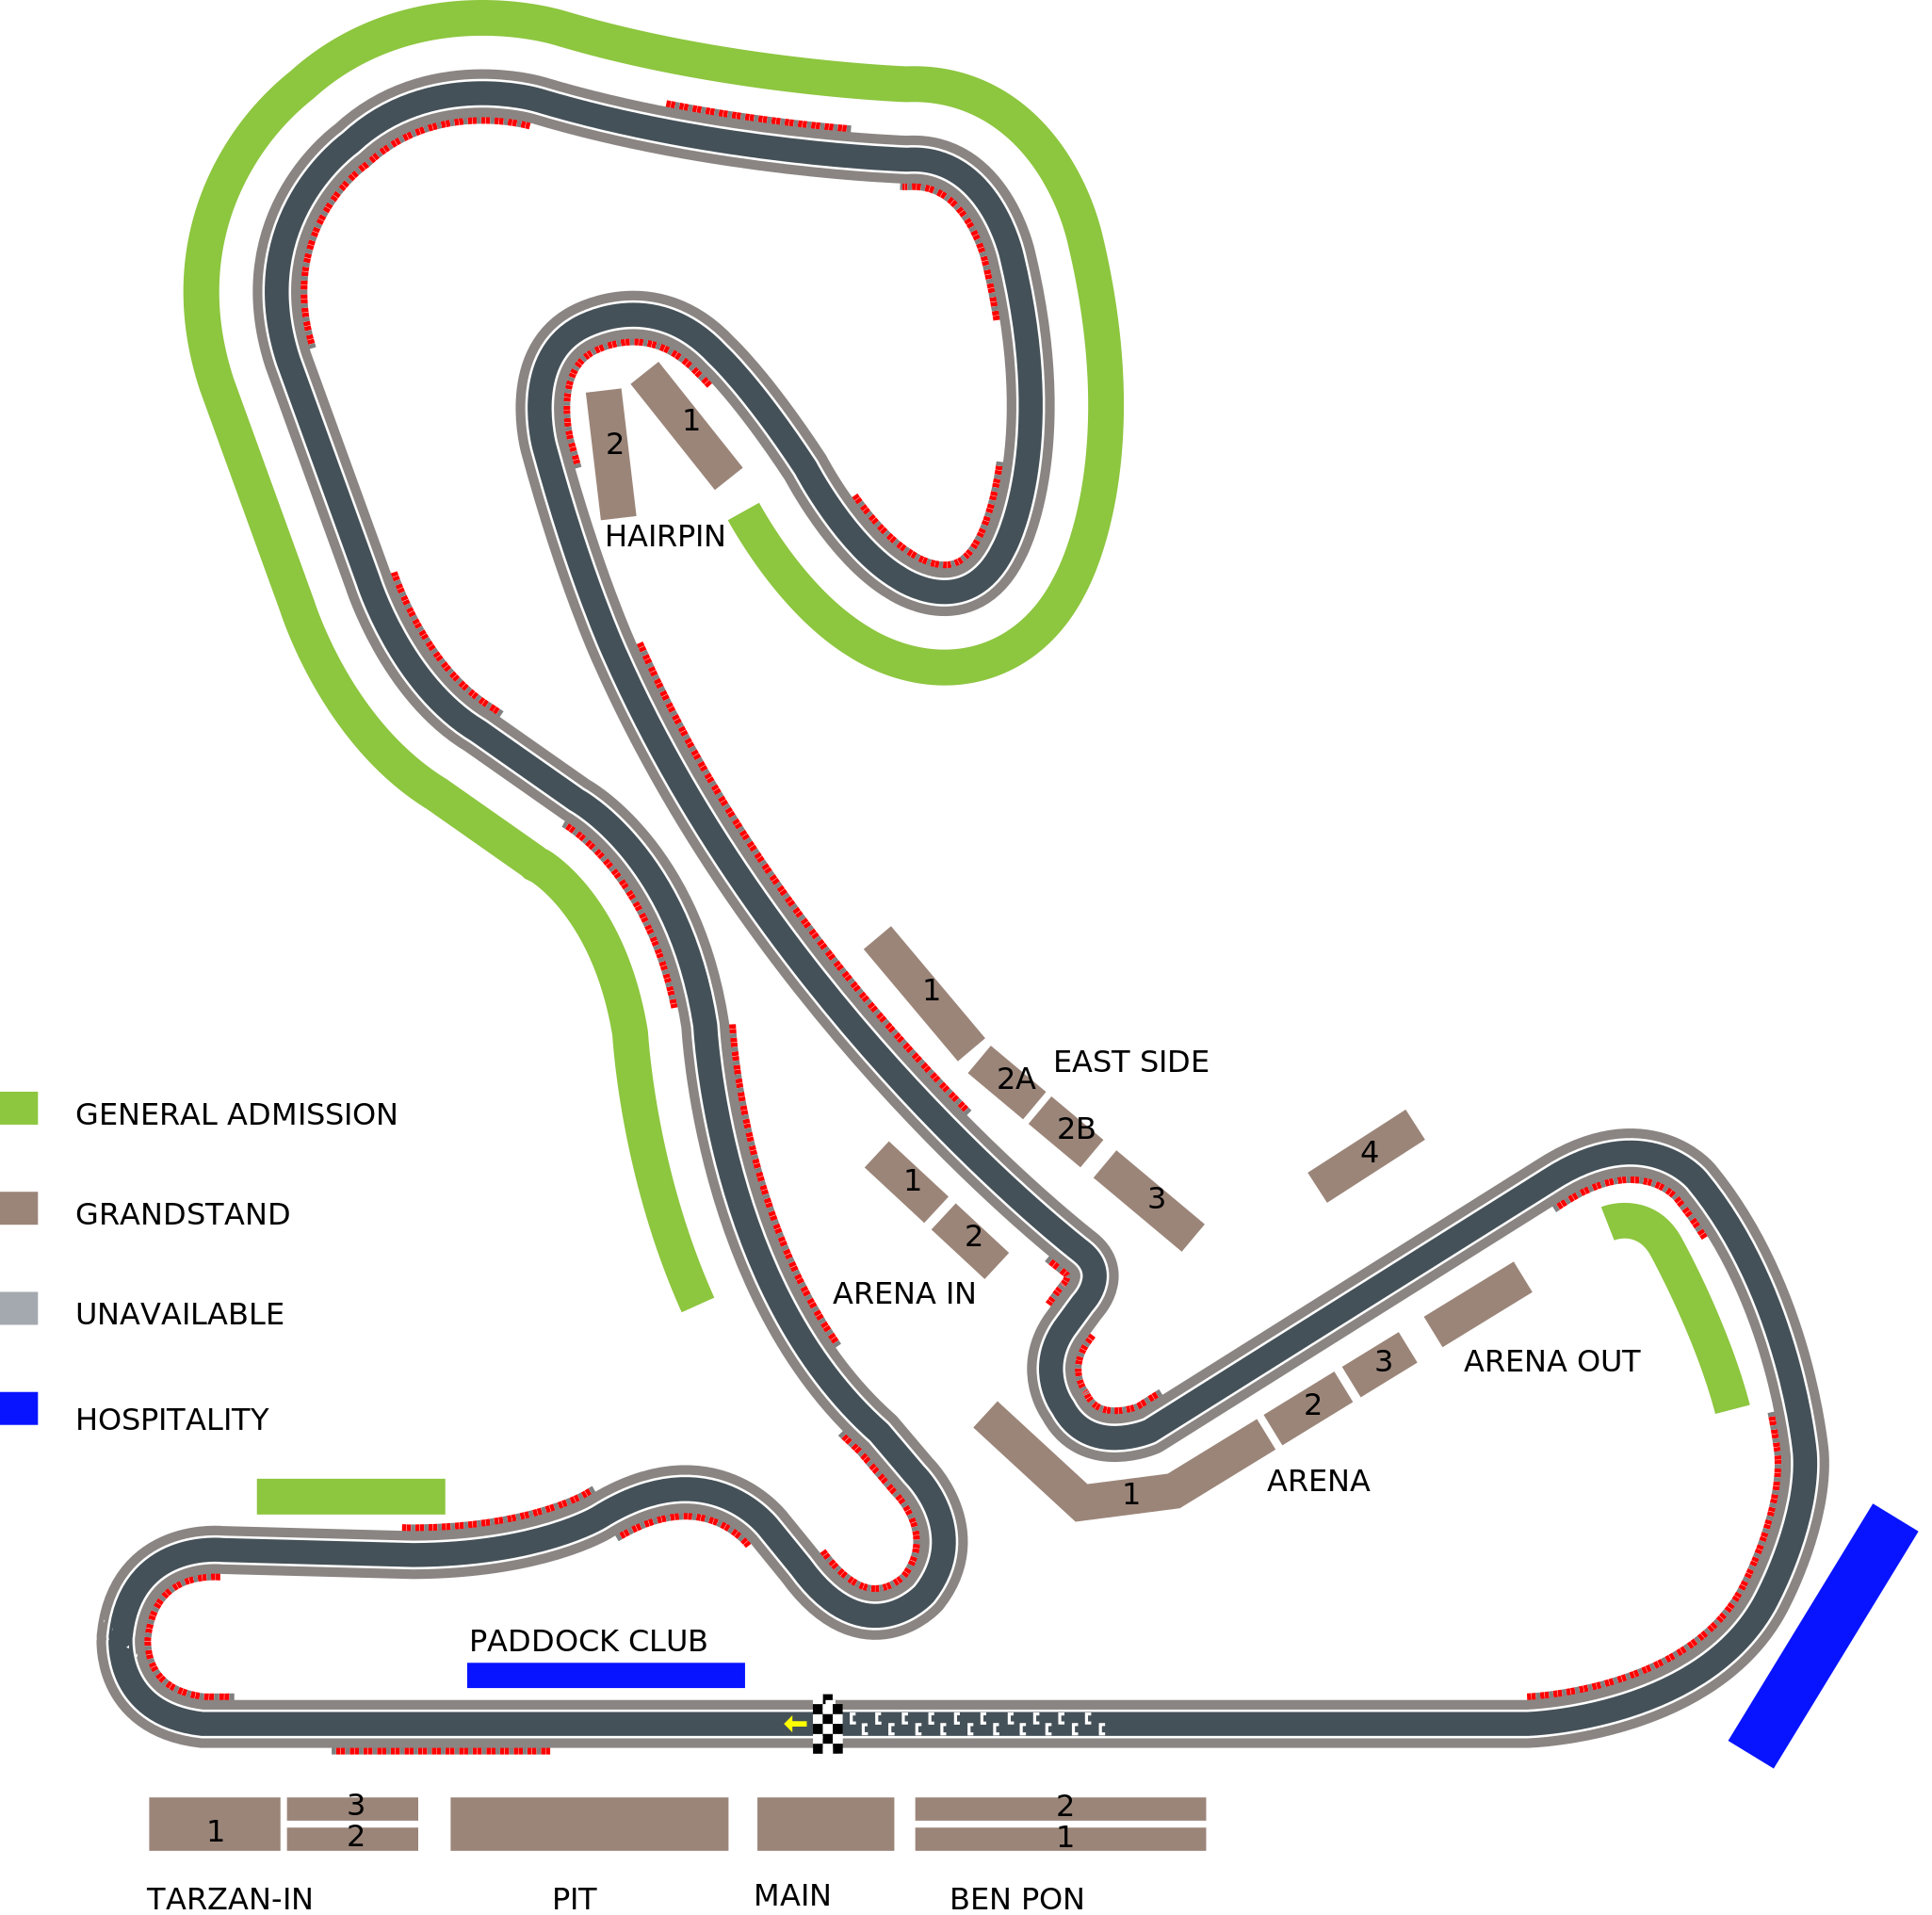 | 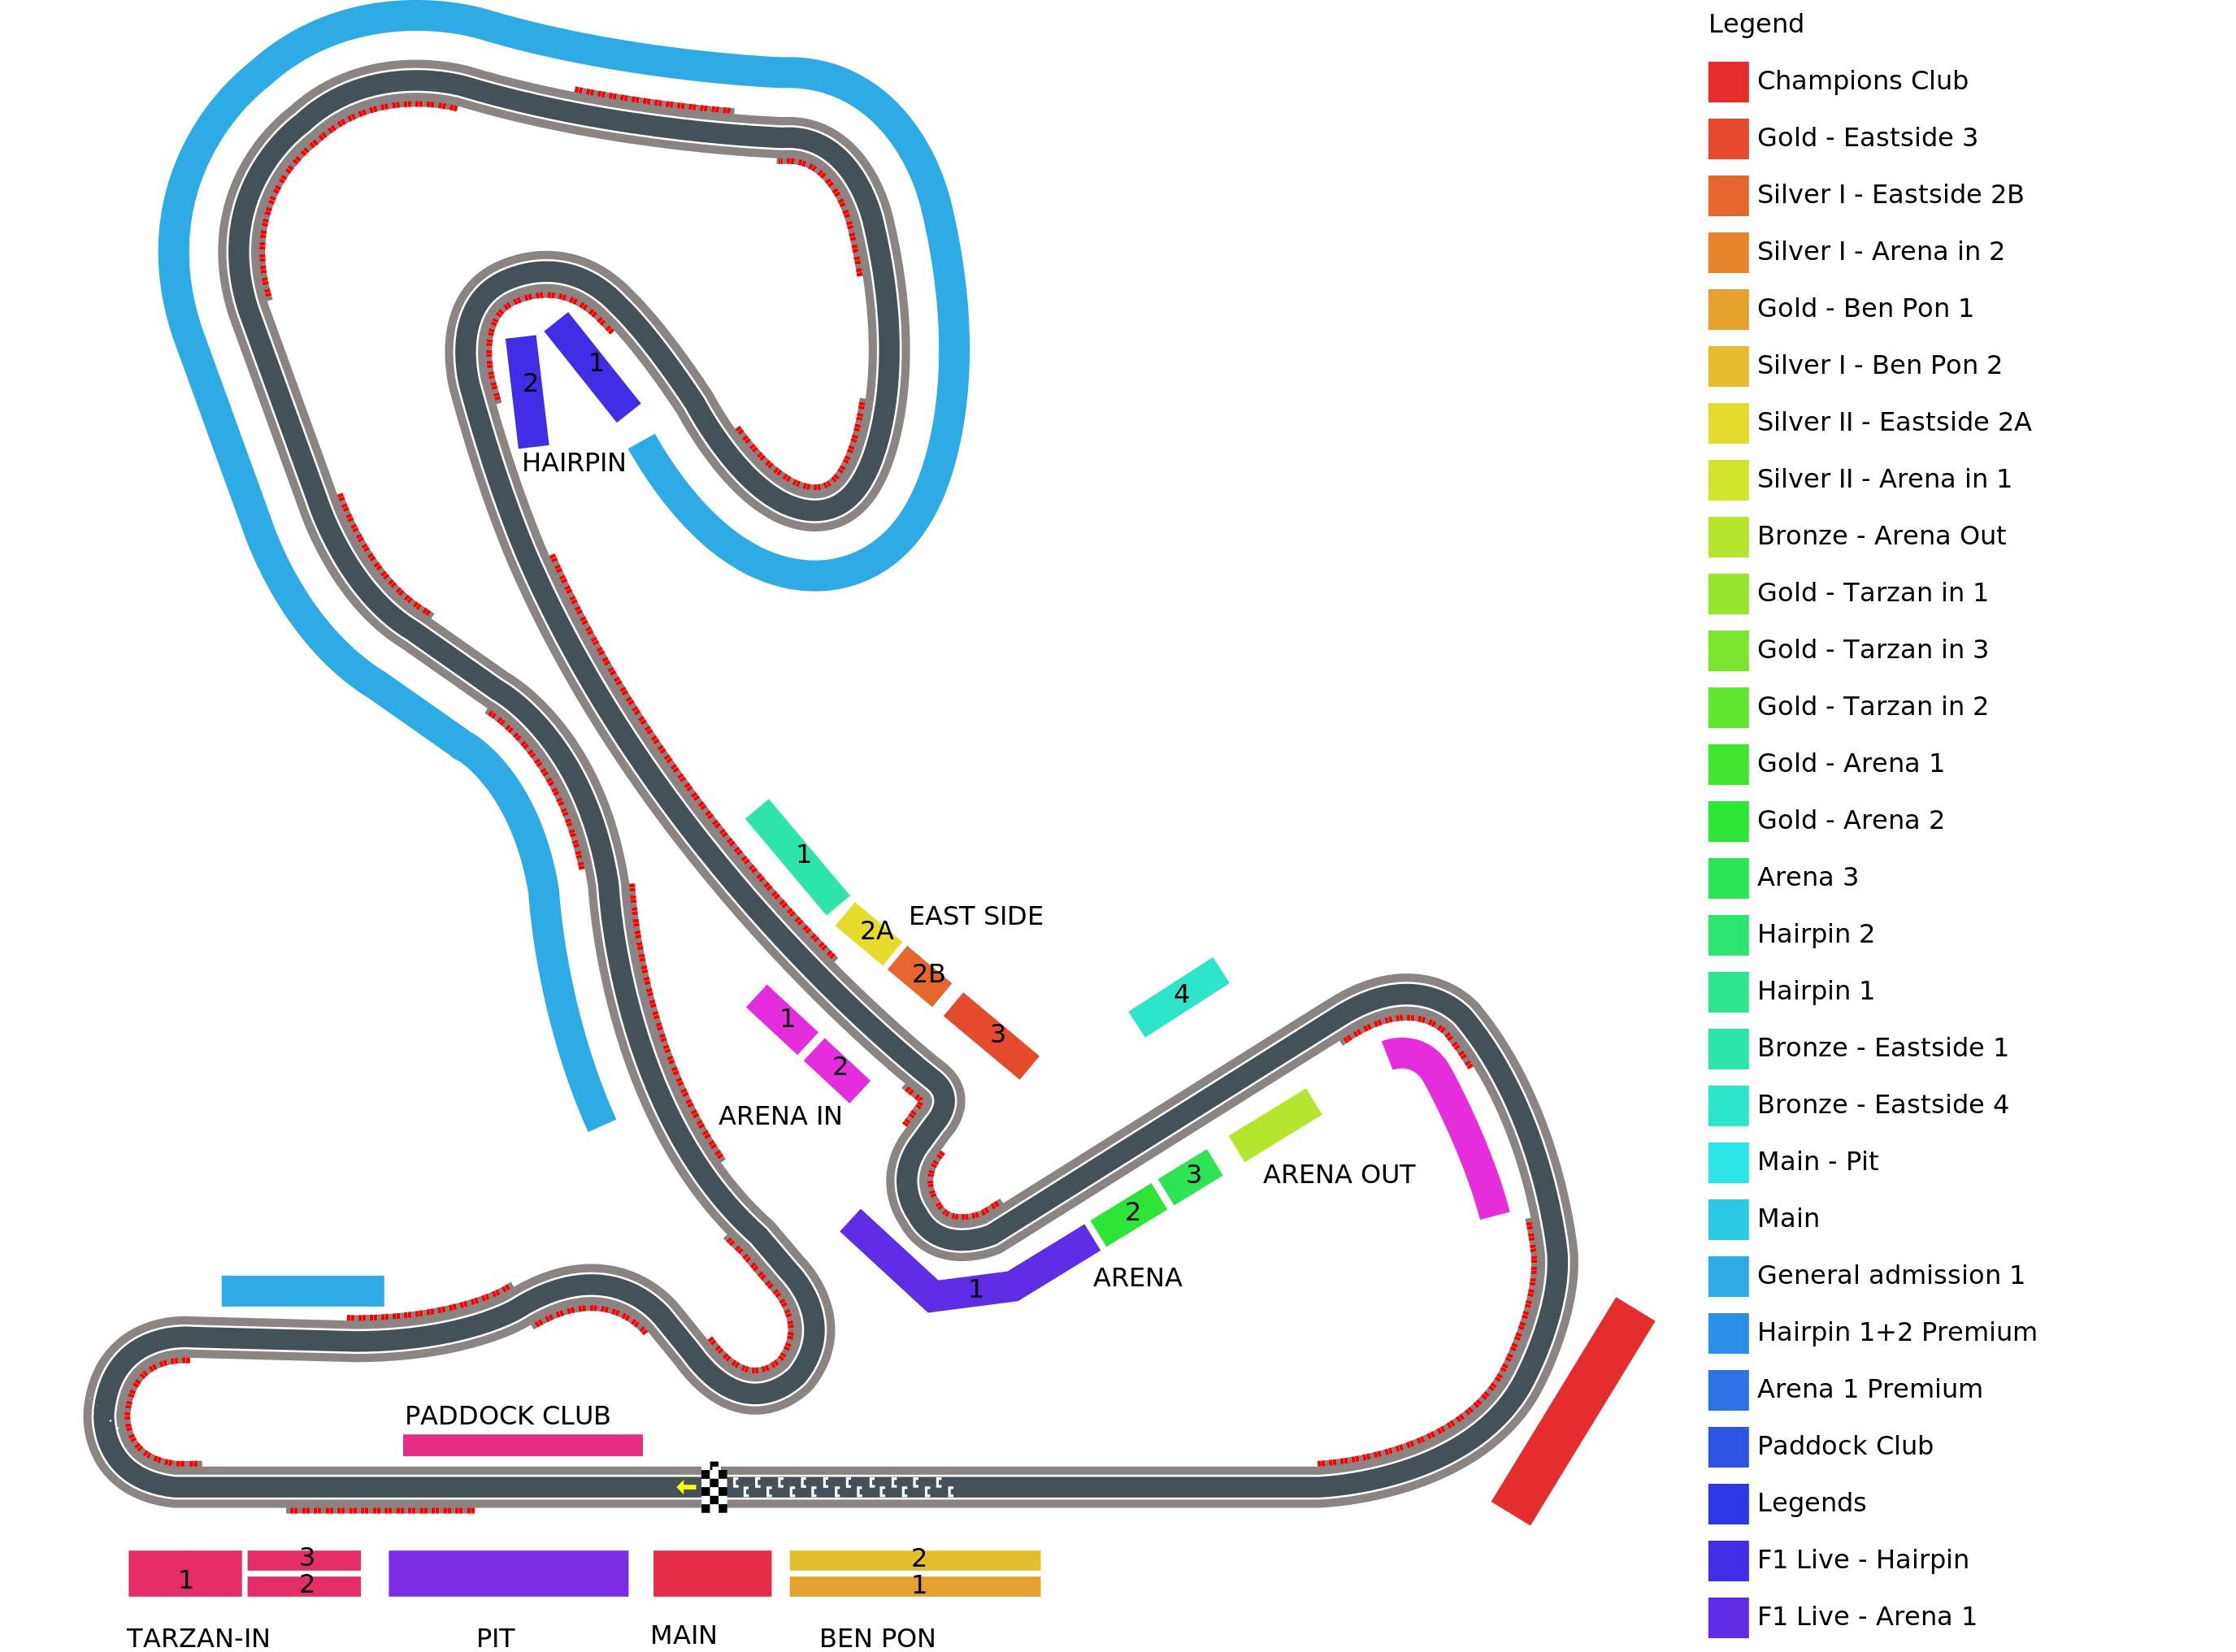 |
INFO
You can enhance your website by integrating interactive venue maps. These maps are hosted as SVG files on our CDN and can be customized using CSS and JavaScript. Follow the steps below to fetch, display, and interact with a venue map.
Each venue has a unique venue_id, which is used to construct the URL for its SVG representation:
https://cdn.xs2event.com/venues/{venue_id}.svgTo get a venue_id, first retrieve event details via our API:
GET /v1/events/:event_idThe API response includes the venue_id, which allows you to construct the SVG URL dynamically:
https://cdn.xs2event.com/venues/{event.venue_id}.svgEach venue map contains elements classified with category-specific identifiers. To fetch category information related to an event, make the following API request:
GET /v1/categories?event_id=:{event_id}This response provides data about each category, which can be used to enhance interactivity.
Once you've obtained the SVG file, embed it in your webpage using a <svg> element. The SVG elements within the file will have classes corresponding to identifiers. Example:
<path d="M1000,700 L1020,710 L1030,720 Z"
      class="9914182a41714cb68b62fb773eb62d27_ctg _9914182a41714cb68b62fb773eb62d27_ctg grandstand _a9eb40eaf483492baa3a7c10fc10ae67_ctg a9eb40eaf483492baa3a7c10fc10ae67_ctg"></path>
Here, this element belongs to two categories: 9914182a41714cb68b62fb773eb62d27_ctg and a9eb40eaf483492baa3a7c10fc10ae67_ctg, as you can notice, the categories also have a version prefixed with a _, this is because not all browser api's can handle classes that start with a number well. You can use these class names to apply styles dynamically.
Use CSS to highlight a category:
.a1aec6dd3f634a5d8c07be757b4510df_ctg:hover {
  fill: #ff0000;
}
Or to give all grandstand elements a gray color
.grandstand {
  fill: #ececec;
}
This is how your stylesheet could look like in the end
.soccerfield {
  fill: green;
}
.svg-background {
  fill: none;
  stroke: #fff;
}
.stadium-ring {
  fill: #8a8582;
}
.svg-background-soccerstadiums {
  fill: white;
}
.track-drive-bbox {
  stroke: none;
  fill: none;
}
.track-drive {
  stroke: #455159;
  fill: none;
  stroke-width: 12.72px;
  stroke-linecap: round;
  stroke-linejoin: round;
}
.track-border {
  stroke: #8a8582;
  fill: none;
  stroke-width: 25.44px;
  stroke-linecap: round;
  stroke-linejoin: round;
}
.track-overlay {
  stroke: white;
  fill: none;
  stroke-width: 15.26px;
  stroke-linecap: round;
  stroke-linejoin: round;
}
.starting-grid {
  stroke: white;
  fill: none;
}
.curve-red {
  fill: red;
}
.curve-grey {
  fill: grey;
}
.drive-arrow {
  fill: yellow;
}
.flag-white {
  fill: white;
}
.flag-black {
  fill: black;
}
.hide {
  fill: none;
  stroke: none;
}

.grandstand-legend,
.grandstand {
  fill: #9b8579;
}
.suite-legend,
.suite {
  fill: #0814ff;
}
.unavailable {
  fill: #a3a9af;
}
.general-admission-legend,
.general-admission {
  fill: #8dc63f;
}To enhance user experience, use JavaScript to highlight a specific category dynamically (e.g., 9914182a41714cb68b62fb773eb62d27_ctg):
const categoryToHighlight = "_9914182a41714cb68b62fb773eb62d27_ctg";
document.querySelectorAll(`.${categoryToHighlight}`).forEach((el) => {
  el.classList.add("highlight");
});Enhance the venue map by implementing features such as:
By following these steps, you can integrate a fully interactive and visually appealing venue map into your website.